Stress is an everyday part of our modern life, which is why it is important to consider how it can affect us in, for example in a training situation. In this blog post, we delve into the depths of stress and its recognition, with the aim of including stress as an input and influencing factor in our future VR trainings.
About Stress in General
When we hear the word “stress,” we don't often consider the depth of its meaning, yet it is part of our everyday life. I'm sure most people have heard or even said the phrase, “Oh, I had such a stressful day again!” but where does this word come from?
The word stress comes from the Latin word "strictus," meaning tight or demanding (in English, "stress" also means tension and pressure). The concept was first described by Hans Selye in 1960:
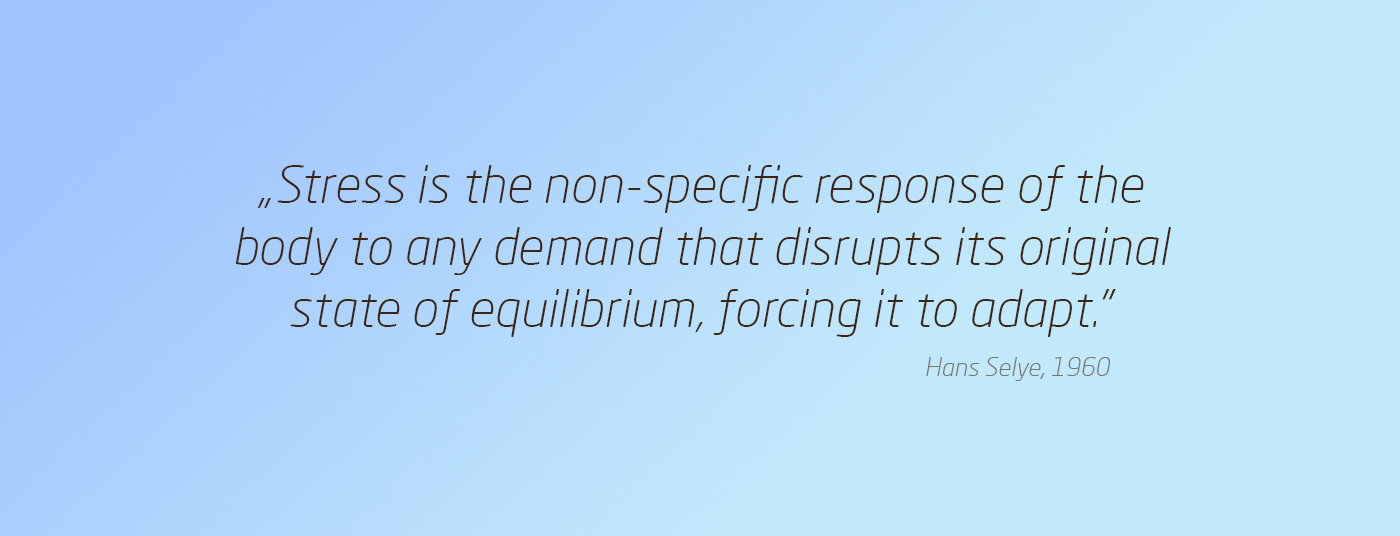
In other words, stress is the body's natural response or reaction to environmental stressors.
Closely related to stress is the “fight or flight” response, which activates when faced with a real or perceived threat or even test anxiety. This triggers the survival mechanism, causing the heart rate to speed up, leading to an increased pulse, blood pressure, or even muscle tension. Examples of this will be discussed later.
Most people, when they hear the word stress, think it always has a negative connotation, but it can also positively affect our lives. Positive stress also challenges the body, pushing it out of its comfort zone and causing tension. However, in this case, the individual is able to handle the challenge, and the stress motivates them to perform (making it positive).
Detecting and Measuring Stress
Detecting stress is not a simple task because it cannot be determined solely by a single value or threshold to decide whether a person was stressed at a given moment. Today, many studies can be found online that attempt to detect and measure stress using various sensors.
The most common metrics and methods used include EEG (electroencephalography), ECG (electrocardiography), EMG (electromyography), GSR (galvanic skin response), HRV (heart rate variability), and skin temperature, all of which are recorded and processed by different sensors and devices. Among these, we chose to detect and measure stress based on HRV analysis.
HRV, or Heart Rate Variability, reflects the variations in the time intervals between successive heartbeats (InterBeat Interval, IBI), and it can be used as a guide to measure and detect stress. In the previously mentioned "fight or flight" response, the heart begins to beat faster, shortening the time between beats, which decreases HRV and can indicate stress. HRV values can be analyzed in both time and frequency domains, and these values can be measured over different durations: ultra-short-term (< 5 minutes), short-term (~/>5 minutes), and long-term (≥ 24 hours). For the validity of some HRV values, it is necessary to determine the duration of the measurement at a minimum, so it is worth performing tests of at least 30 seconds. Our goal was to detect and measure stress in real time, corresponding to the needs of ultra-short-term measurements.
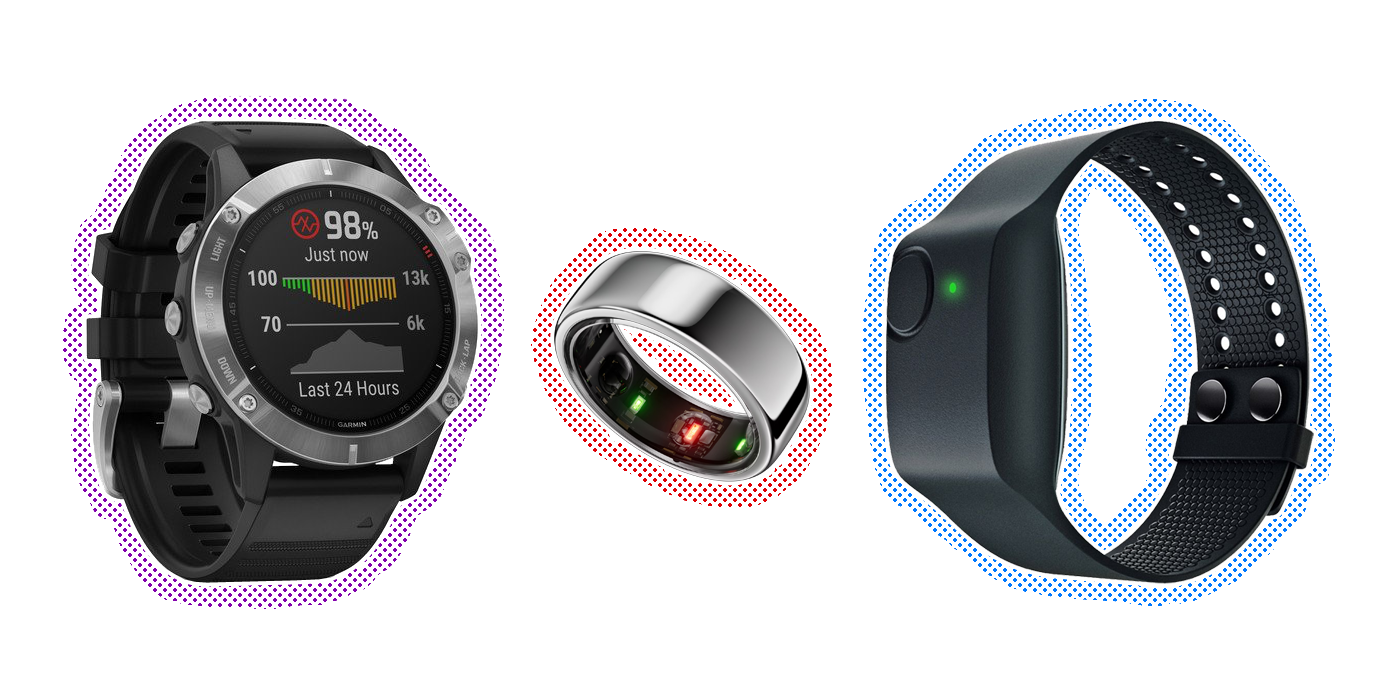
Many studies have tried to detect stress using various wearable sensors, such as the Polar H10 heart rate monitor chest strap, smartwatches (Garmin, Apple), smart rings (Oura Ring), and wristbands (Empatica E4).
We chose the Polar H10 chest strap for stress detection due to its excellent value for money and ability to provide the data we need in our case.
 source: polar.com
Processing the data collected
In most studies, the data collected from the sensors were processed, and the processed data were analyzed using machine learning or deep learning to identify patterns. Machine learning and deep learning are good choices because their technology allows for more accurate and faster data processing, and once they learn patterns, they can classify results. Many datasets available for free online can be useful for training such models, such as SWELL, WESAD, and MIT-BIH, which contain large amounts of data but are often too complex. For this reason, we created our own dataset and began training a model to evaluate the data in real time.
Applied Machine Learning method
In the selected study, many machine learning and deep learning models were tested, and we chose to use TPOT. TPOT is built on the Scikit-Learn machine learning library and applies genetic programming algorithms to automatically discover and optimize the best-performing model pipelines for a given dataset. This means that TPOT automatically selects and combines various preprocessing steps, models, and hyperparameters to achieve the best possible performance. The final output of TPOT is an optimized machine learning pipeline, which includes all the necessary steps from data preprocessing to model selection and hyperparameter tuning. This pipeline can be exported as Python code (resulting in a fully functional model), which can then be loaded later for making predictions.
Binary and Multilevel Stress Detection
In the field of stress measurement, binary stress detection is often used. Most studies found online focus primarily on determining whether a person is in a stressed state or not. However, it’s important to note that multi-level stress detection exists, which is particularly interesting and complex. Multi-level stress detection not only identifies stress but also measures its intensity, which can be categorized as medium, or high. In this case, it is not sufficient to label data based solely on outlier values; it requires comparing the subject's self-reported stress levels and the recorded values to accurately determine stress intensity. By thoroughly analyzing and comparing the values, we can distinguish between moderate and high levels of stress. This ensures that stress detection is accurate and reliable while considering individual differences and contextual factors.
Determining the Level of Stress
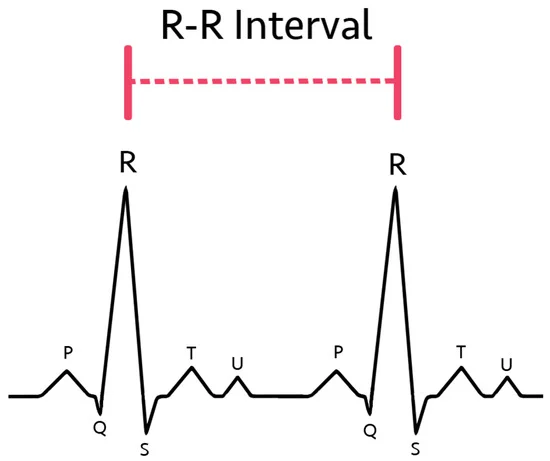
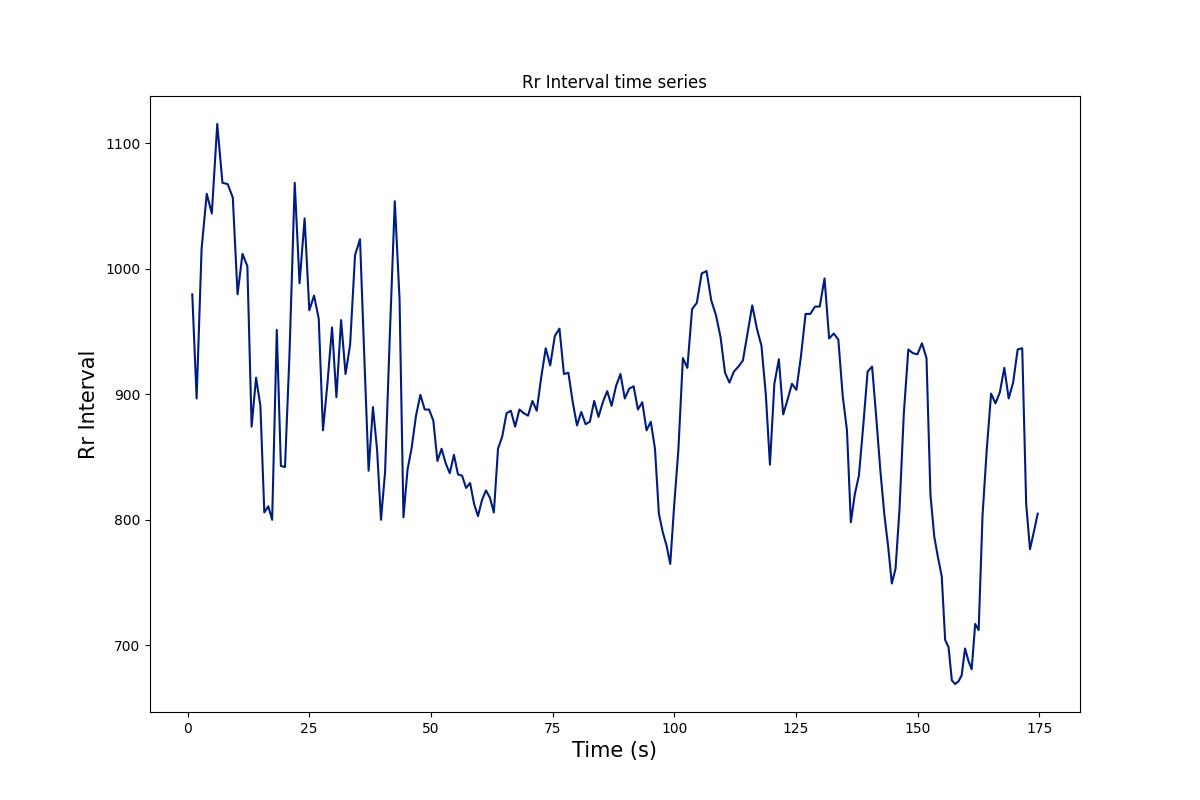
Stress detection and intensity measurement were calculated using the values of HR, RMSSD, AVNN, SDNN, PNN50, VLF, LF, HF, TP, and the LF/HF ratio. For most of these calculations, several Python packages are available online, such as hrv-analysis, hrv, and pyhrv. The primary parameters for the functions in these packages are the RR interval values. The RR interval represents the time elapsed between consecutive heartbeats. Essentially, it forms a time series, which is the foundation of HRV analysis. This value, along with heart rate (HR), is derived from the Polar H10 chest strap sensor in our case.
The sensor communicates via Bluetooth, which was established using a package (Bleak). The values received are already normalized, simplifying data processing. But what exactly are the values we worked with?
- HR (Heart Rate): Heart rate not only increases during physical activity but also rises in stressful situations.
- RMSSD (Root Mean Square of Successive Differences): A measure of heart rate variability; this value tends to decrease under stress.
- AVNN (Average of Normal-to-Normal intervals): The average time between two consecutive normal heartbeats (measured in seconds). Lower AVNN values can indicate higher heart rate and possibly greater stress.
- SDNN(Standard Deviation of NN intervals) : The standard deviation of the NN intervals, reflecting both sympathetic and parasympathetic activity, and tends to decrease under stress.
- pNN50: A percentage that shows the proportion of NN intervals greater than 50 ms. This value indicates how active the parasympathetic nervous system is compared to the sympathetic system. Higher pNN50 means the body is more relaxed, while lower values suggest fatigue or excessive stress. *VLF (Very Low Frequency): Reflects the power of very low-frequency waves, representing how hormones and reflexes affect the heart. High VLF indicates that the body is exhausted or sick and not handling stress well.
- LF (Low Frequency): Represents the power of low-frequency waves generated by the sympathetic nervous system.
- HF (High Frequency): Reflects the power of high-frequency waves generated by the parasympathetic nervous system. The higher this value, the more relaxed the body. It also indicates fitness, as healthy and active athletes tend to have higher HF values at rest. During stress detection, we observed a decrease in this value.
- TP (Total Power): Reflects the total power of HF, LF, and VLF waves, indicating how well the body adapts to stress. This value decreases when a person is too stressed or sick.
- LF/HF Ratio: Indicates whether the parasympathetic or sympathetic nervous system is more active. A value above 2 means the body's systems are too mobilized, while a value below 1 means the body is relaxed. A value between 1 and 2 indicates balanced systems. However, during measurements, this ratio often exceeded the typical 1-2 range, with some subjects showing values as high as 16. This can be explained by high sympathetic nervous system activity, which may be due to pathological stress or nervousness, as well as the subject's health condition (e.g., cardiovascular problems).
During the test, the primary indicator was heart rate. In stressed subjects, heart rate increased sharply compared to resting seated and standing values. This was consistently followed by changes in HF, LF/HF ratio, RMSSD, SDNN, and pNN50. Under stress, HF and LF/HF values increased, while RMSSD, SDNN, and pNN50 values decreased.
Stress Testing in Real Conditions using VR
During data collection, there are many other factors to consider alongside the measured values. Numerous elements can influence these values. For instance, if the subject engaged in strenuous physical activity or consumed caffeine before the measurement, it could elevate heart rate (and potentially affect other metrics), leading to inaccurate or misleading data.
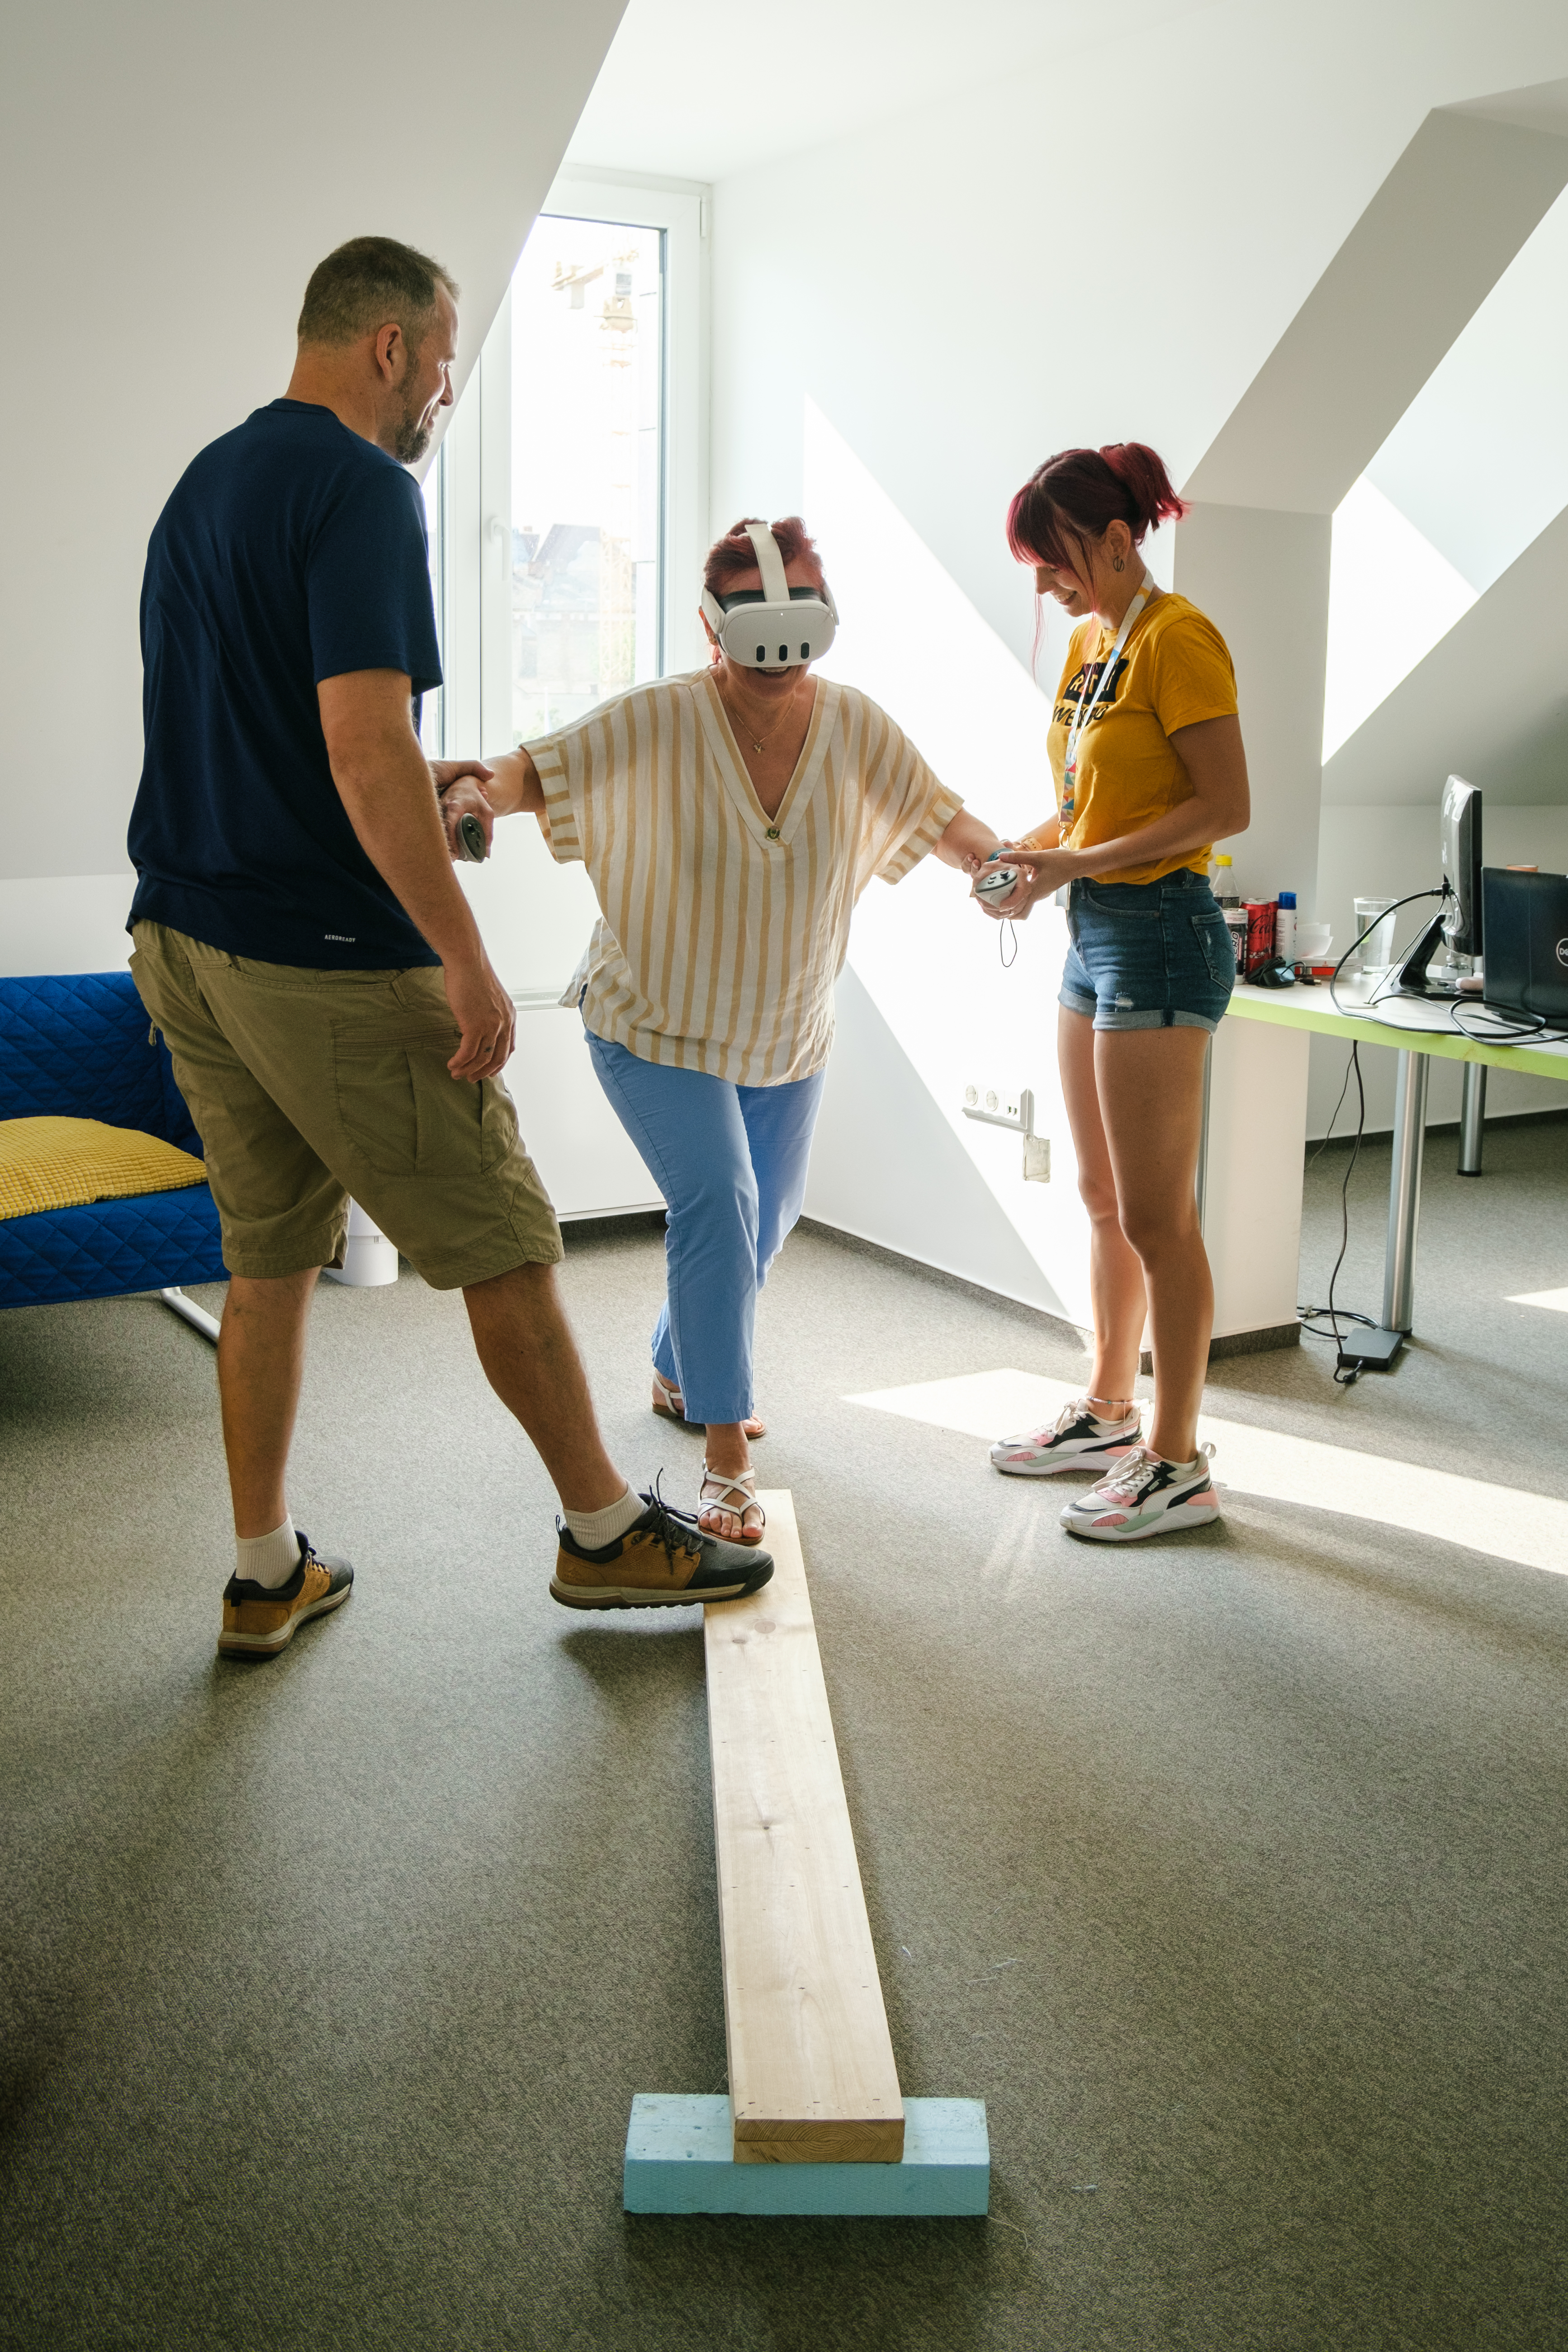
Stress can be induced in several ways under controlled conditions, and we employed two different methods for measuring it. In the first case, stress was triggered by requiring the subject to complete a task within a time limit. In the second case, stress was induced by fear of heights (acrophobia). The most effective tool for reaching a high stress level was the use of a VR headset.
In recent years, virtual reality (VR) technology has advanced significantly and has become more widespread. This technological progress has also allowed VR to become an effective tool for measuring stress. But how exactly do stress measurement and VR connect?
During the entire testing process, participants experienced the stress-inducing applications through the Meta Quest 3 headset. The Meta Horizon Store offers a wide variety of free and paid applications that can enhance the realism of the experience, thereby providing more accurate data. The workflow was designed based on a study we selected, with the goal of constructing a setup that would elicit the highest possible stress levels from participants using the VR headset. The challenge lay in finding tasks that would trigger stress in the majority of test subjects. This is not a simple task, as stress is subjective—what might stress out most people may not affect others the same way. Some participants had never tried VR before, which made the experience much more intense for them, as evidenced by the collected data.
Each testing session started and ended with a relaxation task to ensure that the stress-inducing phases were clearly distinguishable. In the case of acrophobia (fear of heights)-based stress, to make the experience even more immersive, we built a custom set tailored to the chosen VR application. The success of this was far greater than anticipated. In some cases, the reactions were much more pronounced, as indicated by sweating palms, trembling hands and legs, and muscle tension in the participants.
The timing for stress detection was largely determined by the data collection and model training, as neither was straightforward initially. A significant amount of research and review of studies and publications was necessary to start the process. The workflow and data collection methods underwent numerous changes before reaching an optimal state.
In my opinion, stress detection has a promising future and will become increasingly prevalent and advanced in various fields. In education, for example, it could play a significant role during exams; if a student is excessively stressed, appropriate interventions could be employed to mitigate stress levels. Additionally, in healthcare, stress detection could be crucial for the early diagnosis and management of stress-related conditions.
The stress measurement work was conducted as part of the XR2Learn project.
Sources:
- https://www.eletmodorvosikozpont.hu/eletmod-orvoslas/stresszkezeles
- https://www.gortvacoaching.hu/l/stressz/
- https://www.abcterapia.hu/blog/itemlist/tag/%C3%BCss%20vagy%20fuss
- https://egeszsegvonal.gov.hu/s-sz/1038-stresszreakcio.html
- https://support.polar.com/e_manuals/Team_Pro/Polar_Team_Pro_user_manual_Magyar/Content/RR-interval.htm
- https://www.futas.net/kerekparos/edzes/teljesitmenydiagnosztika.php
- https://hrvlab.wustl.edu/research/methods/time-domain-heart-rate-variability/
- https://www.webmd.com/balance/stress-management/news/20240104/heart-rate-variability-anti-stress-weapon
- https://learn.microsoft.com/hu-hu/azure/machine-learning/concept-automated-ml?view=azureml-api-2
- TPOT for Automated Machine Learning in Python - MachineLearningMastery.com
- RR interval image: https://www.mdpi.com/1424-8220/23/7/3700
Article written by T. Cintia
Translated by F. Flóra